2. Materials and Methods
2.1. Reagents
All reagents used in this study were of analytical grade and were used as received without further purification. Cochineal Red A (E124) dye was used as the target pollutant. Phosphoric acid (H3PO4) was employed as the chemical activating agent for the raw biomass (GH). Hydrogen peroxide (H2O2) served as the oxidant in the Fenton reaction. Sodium hydroxide (NaOH), ferrous sulfate heptahydrate (FeSO4 7H2O), and ferric chloride hexahydrate (FeCl3·6H2O) were used for the synthesis of ferromagnetic activated carbon (ACGH-Fe3O4).
2.2. Methods
2.2.1. Preparation of Activated Carbon
Activated carbon was prepared from cotton stalks (Gossypium herbaceum, GH). Cotton stalks were washed, dried, crushed, and sieved (<100 μm). Fifty grams of biomass were impregnated with 150 mL of 7% H3PO4 under stirring for 2 h, dried at 105°C, and carbonized at 450°C for 2 h (5°C.min−1). The obtained material was washed to neutral pH and dried at 105°C for 24 h to obtain activated carbon (ACGH).
2.2.2. Synthesis of the Ferromagnetic Catalyst
The ferromagnetic catalyst was synthesized by modifying activated carbon (ACGH) through the co-precipitation method of Fe
2+ and Fe
3+ ions
| [5] | Zhang, Z., Shao, Y., Hu, Y., Shen, Y., & Chen, X. (2020). Magnetic biochar composites for wastewater treatment: A review. Environmental Pollution, 256, 113291.
https://doi.org/10.1016/j.envpol.2019.113291 |
[5]
. For this purpose, 13.93 g of ferric chloride hexahydrate (FeCl
3.6H₂O) and 10 g of ferrous sulfate heptahydrate (FeSO
4.7H
2O) were dissolved in 250 mL of distilled water under continuous stirring in a 500 mL flask. Subsequently, 10 g of activated carbon (ACGH) was introduced into the solution, and the reaction temperature was maintained at 80°C. The precipitation of magnetite (Fe
3O
4) nanoparticles was induced by the gradual addition of 5 g of sodium hydroxide (NaOH). Under these alkaline conditions, Fe
2+ and Fe
3+ ions react with hydroxide ions to form Fe
3O
4 particles. During this process, Fe
3O
4 nanoparticles were deposited onto the surface of the activated carbon, leading to the formation of a ferromagnetic composite material with enhanced catalytic properties and magnetic separability. After 1 h of reaction, the resulting material was washed, centrifuged and dried. The obtained ferromagnetic activated carbon was designated as ACGH-Fe
3O
4. The formation mechanism of ferromagnetic activated can be described by the equation (
1).
(1)
2.2.3. Material Characterization Techniques
Several characterization techniques were employed to investigate the physicochemical properties of the materials (GH, ACGH, and ACGH-Fe3O4). Fourier Transform Infrared (FTIR) spectroscopy was used to identify the surface functional groups present in the materials. The spectra were recorded using a Nicolet iS5 Thermo Scientific spectrometer in the range of 4000-400 cm-1 using the attenuated total reflectance (ATR) mode. The surface morphology and elemental composition of the samples were analyzed using a field emission scanning electron microscope (FESEM) coupled with energy-dispersive X-ray spectroscopy (EDX). The analyses were performed using a JEOL JSM-6390A microscope (Tokyo, Japan) operated at an accelerating voltage of 10 kV with a magnification range from 25× to 1000 kx. The crystalline phases of the materials were determined by X-ray diffraction (XRD) analysis using a PANalytical X’Pert Pro powder diffractometer equipped with Cu Kα radiation (λ = 1.54056 Ǻ). The instrument was operated at 40 kV and 30 mA, with a scanning speed of 5° min-1 over a 2θ range from 10° to 90°. The specific surface area, pore size distribution, and pore volume were determined from nitrogen adsorption–desorption isotherms using the Brunauer–Emmett–Teller (BET) and Barrett–Joyner–Halenda (BJH) models. The measurements were carried out using a BELSORP MAX analyzer (BEL Japan Inc., Japan). All adsorption experiments were performed at 77 K.
2.2.4. Degradation Experiments Using the Heterogeneous Fenton Process
The degradation experiments were carried out at room temperature. For each experiment, 100 mL of E124 dye solution with an initial concentration ranging from 100 to 200 mg.L
-1 and a pH between 3 and 7 was introduced into a 200 mL Erlenmeyer flask. Subsequently, 5 mL of hydrogen peroxide (H
2O
2) with a concentration ranging from 0.5 to 1.5 mol.L
-1 and a catalyst mass of ACGH-Fe
3O
4 between 50 and 100 mg were added to the solution. The pH of the solution was adjusted using H
2SO
4 (0.1 mol. L
-1) or NaOH (0.1 mol. L
-1) solutions. The reaction mixture was magnetically stirred for the desired reaction time. At predetermined time intervals, 5 mL of the reaction solution was withdrawn using a pipette and filtered through filter paper. Immediately after filtration, two drops of methanol were added to the filtrate to quench the radical reaction
| [13] | T. G. Kenda, C. G. Fotsop, D. R. T. Tchuifon, P. A. N. Kouteu, T. F. Fanle, S. G. Anagho,(2024). Building TiO2-doped magnetic biochars from Citrus sinensis peels as low-cost materials for improveddye degradation using a mathematical approach, Applied Surface Science Advances 19, 100554. |
[13]
. The absorbance of the treated solution was measured using a SECOMAM S.500 UV-visible spectrophotometer at the maximum absorption wavelength (λmax = 510 nm) to determine the residual dye concentration. The degradation efficiency (Ed,%) of E124 dye was calculated using Equation (
2):
Where: C0 is the initial dye concentration (mg. L-1), Ct is the dye concentration at reaction time t (min).
2.2.5. Optimization of the Catalytic Performance of the Synthesized Materials
Before the experimental design based on response surface methodology, preliminary experiments were conducted to evaluate the catalytic performance of ACGH and ACGH-Fe3O4 in removing E124 dye via adsorption and heterogeneous Fenton degradation. These preliminary tests were carried out in order to identify the most efficient material for subsequent optimization studies. For each experiment, 100 mL of E124 dye solution with an initial concentration of 100 mg. L-1 was introduced into a 200 mL Erlenmeyer flask, and the pH of the solution was adjusted to 3. Subsequently, 50 mg of catalyst and 5 mL of hydrogen peroxide (H2O2) with a concentration of 0.5 mol. L-1 was added to the solution. The reaction mixture was magnetically stirred for a maximum reaction time of 60 min. At predetermined time intervals, 5 mL of the reaction mixture was withdrawn using a pipette, filtered through filter paper, and immediately quenched by adding two drops of methanol to stop the radical reaction. The collected samples were analyzed using a UV-visible spectrophotometer (SECOMAM S500) at the maximum absorption wavelength (λmax = 510 nm) to determine the residual dye concentration.
2.2.6. Design of Degradation Experiments Using Response Surface Methodology (RSM)
Response surface methodology (RSM) based on the Box-Behnken design (BBD) was used to optimize the operating parameters for the degradation of E124 dye in order to determine the optimal conditions for maximum degradation. The experimental design and the generation of the experimental matrix were performed using Statgraphics Plus 18.0 software. Four independent variables were considered in this study: the pH of the solution (A), the catalyst mass of the ACGH-Fe
3O
4 composite material (B), the initial concentration of E124 dye (C), and the H
2O
2 concentration (D). For four independent variables and six center points, the Box-Behnken design generated 30 experimental runs, as described by Equation (
3).
(3)
Where k is the number of experimental variables considered in the optimization study, n
0 is the number of center points, and nf is the total number of experimental runs. The minimum (−1), central (0), and maximum (+1) levels of the independent variables used in the model are presented in
Table 1.
Table 1. Levels of the independent variables used in the Box–Behnken design.
Variables | Units | Coded variables | Variables levels |
+1 | 0 | -1 |
pH | | A | 3 | 5 | 7 |
Mass | mg | B | 50 | 75 | 100 |
[E124] | mg.L-1 | C | 100 | 150 | 200 |
[H2O2] | mol.L-1 | D | 0.5 | 1.0 | 1.5 |
An empirical model was developed based on the responses obtained from the 30 experimental runs. The interactions between the experimental variables and their influence on the response were described using a classical second-order polynomial model, including linear, quadratic, and interaction terms, as expressed in Equation (
4).
(4)
Where Y represents the predicted response, is the intercept of the quadratic equation, represents the linear coefficients, represents the quadratic coefficients, and represents the interaction coefficients between variables. xi and xj are the coded values of the experimental variables used in the degradation experiments, and ε represents the residual error between the experimental and predicted values. Analysis of variance (ANOVA) was used to evaluate the statistical significance of the model terms and to assess the adequacy of the regression model. The degradation efficiency of E124 dye was used as the response variable for the optimization study.
2.2.7. Kinetic Studies and Modelling of the Dye Degradation Reaction
The kinetics of E124 dye degradation were investigated using pseudo-first-order and pseudo-second-order kinetic models. These models were used to evaluate the reaction rate and to determine the most appropriate kinetic mechanism describing the degradation process. The linear forms of the first-order and second-order kinetic models are given by Equations (
5) and (
6), respectively.
Where t represents the degradation time, Cₜ is the concentration of E124 dye at time t, C₀ is the initial dye concentration at t =0, and k is the apparent rate constant of the reaction. The experimental data were fitted using linear regression analysis, and the kinetic models were compared based on the values of the correlation coefficient (R2). The model presenting the highest R2 value was considered the most suitable for describing the degradation kinetics of E124 dye.
2.2.8. Reusability Studies
The reusability of the ACGH-Fe
3O
4 catalyst was investigated in order to evaluate its ability to maintain catalytic efficiency over repeated degradation cycles. This study provides important information about the catalytic stability of the material and its potential practical application in wastewater treatment. The first degradation cycle was carried out using 100 mg of ACGH-Fe
3O
4 in 200 mL of dye solution at the optimal concentration and pH determined from the experimental protocol. Subsequently, 5 mL of H
2O
2 at the predetermined optimal concentration was added to the reaction mixture contained in a 200 mL Erlenmeyer flask. The mixture was magnetically stirred for 60 min. After the reaction, 5 mL of the solution was withdrawn, filtered, and analyzed using UV–visible spectrophotometry to determine the residual dye concentration. The percentage of dye degradation during this first cycle was calculated using equation (
2). The ACGH-Fe
3O
4 catalyst was then recovered from the reaction mixture by magnetic separation. The recovered material was washed with distilled water by centrifugation at 3000 rpm for 5 min, and this washing step was repeated three times to remove residual reactants and possible intermediates. After washing, the material was dried in an oven at 100°C for 2 h and reused in the next degradation experiment. This procedure was repeated for four additional cycles, allowing the evaluation of the catalytic stability of the material over five consecutive degradation cycles, and the corresponding dye degradation efficiencies were calculated.
3. Results and Discussion
3.1. BET and BJH Analysis
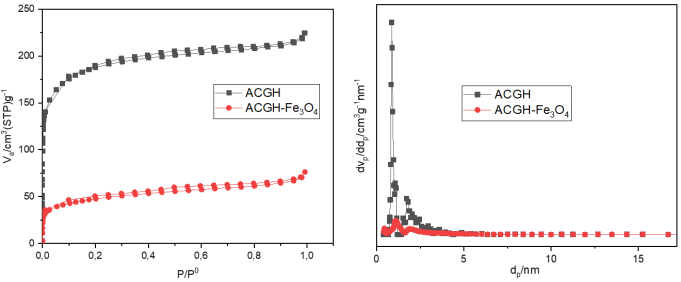
The textural properties of ACGH and ACGH-Fe
3O
4 materials were investigated using nitrogen (N₂) adsorption–desorption isotherms at 77 K. The obtained isotherms are presented in
Figure 1A, while the corresponding pore size distribution curves are shown in
Figure 1B. The values of the BET specific surface area, total pore volume, and average pore diameter for ACGH and ACGH-Fe
3O
4 are summarized in
Table 2.
Table 2. BET specific surface area, total pore volume, and pore diameter of ACGH and ACGH–Fe₃O₄ materials.
Materials | BET surface area (m2. g-1) | Total pore volume (cm3. g-1) | Average pore diameter (nm) |
ACGH | 694,35 | 0,326 | 3,4 |
ACGH-Fe3O4 | 287,14 | 0,099825 | 4,3 |
Figure 1. Nitrogen (N₂) adsorption–desorption isotherms (A) and pore size distribution curves (BJH) (B) of ACGH and ACGH-Fe3O4materials.
Figure 1A shows adsorption–desorption isotherms with a gradual increase at high relative pressures (P/P₀ ≈ 0.9), indicating the coexistence of microporous and mesoporous structures. According to the IUPAC (International Union of Pure and Applied Chemistry) classification, the materials exhibit combined type I and type IV isotherms with an H3 hysteresis loop, characteristic of mesoporous materials with slit-shaped pores
| [14] | Mbouombouo B. Jacques B., Guy, N. P., Jules, M. L., Harlette, Z. P., Maffeu, E. J., Said, M., et al. (2023). Removal of crystal violet by TiO2 loaded alkali-activated carbon hybrid material from Raphia farinifera fruit kernels: surface chemistry, parameters and mechanisms. Biomass Conv. Bioref.
https://doi.org/10.1007/s13399-023-04988-y |
[14]
. Such textural properties are favorable for the adsorption of large organic molecules such as Cochineal Red A (E124). The BJH pore size distribution (
Figure 1B) confirmed the mesoporous nature of the materials, with average pore diameters of 3.4 nm for ACGH and 4.3 nm for ACGH-Fe
3O
4, consistent with BET results (
Table 2). BET analysis revealed that ACGH possessed a higher specific surface area (694.35 m
2.g
−1) than ACGH-Fe
3O
4 (287.14 m
2.g
−1). The decrease after magnetization is attributed to the partial blockage of pores by Fe3O4 nanoparticles, as supported by the reduction in total pore volume. Similar modifications of textural properties after metal incorporation have been reported previously without significant loss of catalytic performance
| [5] | Zhang, Z., Shao, Y., Hu, Y., Shen, Y., & Chen, X. (2020). Magnetic biochar composites for wastewater treatment: A review. Environmental Pollution, 256, 113291.
https://doi.org/10.1016/j.envpol.2019.113291 |
| [12] | Spessato, L.; Duarte, V. A.; Viero, P.; Zanella, H.; Fonseca, J. M.; Arroyo, P. A.; Almeida, V. C. (2021). Optimization of Sibipiruna Activated Carbon Preparation by Simplex-Centroid Mixture Design for Simultaneous Adsorption of Rhodamine B and Metformin. J. Hazard. Mater, 411, 125166. |
[5, 12]
.
3.2. Fourier Transform Infrared (FTIR) Analysis
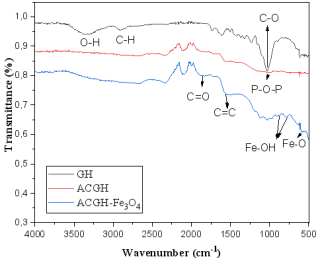
FTIR analysis was carried out on GH, ACGH, and ACGH-Fe
3O
4 samples to identify the surface functional groups present in the raw material and the synthesized materials. The obtained spectra are presented in
Figure 2.
Figure 2. FT-IR spectra of GH, ACGH, and ACGH-Fe3O4.
The FTIR spectrum of GH shows a broad band around 3367 cm
−1 attributed to O–H stretching vibrations of hydroxyl groups and adsorbed water molecules
| [15] | Parshetti, G. K., Killedar, D. J., & Balasubramanian, R. (2010). Production of activated carbon from urban organic waste by chemical activation: application to adsorption of phenol. Chemical Engineering Journal, 165(1), 201–208.
https://doi.org/10.1016/j.cej.2010.09.019 |
[15]
. The band near 2920 cm
−1 corresponds to C–H stretching vibrations of aliphatic groups
| [15] | Parshetti, G. K., Killedar, D. J., & Balasubramanian, R. (2010). Production of activated carbon from urban organic waste by chemical activation: application to adsorption of phenol. Chemical Engineering Journal, 165(1), 201–208.
https://doi.org/10.1016/j.cej.2010.09.019 |
[15]
, while bands around 1722, 1600, and 1030 cm
−1 are assigned to C=O, C=C/C=N, and C–O stretching vibrations associated with lignocellulosic structures
| [15] | Parshetti, G. K., Killedar, D. J., & Balasubramanian, R. (2010). Production of activated carbon from urban organic waste by chemical activation: application to adsorption of phenol. Chemical Engineering Journal, 165(1), 201–208.
https://doi.org/10.1016/j.cej.2010.09.019 |
| [16] | Lall, A., Kamdem Tamo, A., Doench, I., David, L., Nunes de Oliveira, P., Gorzelanny, C., et al. (2020). Nanoparticles and colloidal hydrogels of chitosan-caseinate polyelectrolyte complexes for drug-controlled release applications. Int. J. Mol. Sci. 21, 5602.
https://doi.org/10.3390/ijms21165602 |
| [17] | Djouonkep, L. D. W., Tamo, A. K., Doench, I., Selabi, N. B. S., Ilunga, E. M., Lenwoue, A. k., et al. (2022). Synthesis of high performance thiophene–aromatic polyesters from bio-sourced organic acids and polysaccharide-derived diol: characterization and degradability studies. Mol 27, 325.
https://doi.org/10.3390/molecules27010325 |
[15-17]
. After phosphoric acid activation, the FTIR spectra of ACGH and ACGH-Fe
3O
4 exhibit significant modifications of these bands, indicating structural changes in the carbon matrix. The appearance of bands around 1080 cm
−1 confirms the presence of phosphate groups (P–O–P or P–O–C) formed during H
3PO
4 activation
| [2] | Benmessaoud, S.; Anissi, J.; Kara, M.; Assouguem, A.; AL-Huqail, A. A.; Germoush, M. O.; Ullah, R.; Ercisli, S.; Bahhou, J. (2022), Isolation and Characterization of Three New Crude Oil Degrading Yeast Strains, Candida Parapsilosis SK1, Rhodotorula Mucilaginosa SK2 and SK3. Sustainability, 14, 3465. |
[2]
. In the ACGH-Fe
3O
4 spectrum, the characteristic band observed at 550–580 cm
−1 is attributed to Fe–O stretching vibrations of magnetite (Fe
3O
4) nanoparticles
| [18] | Ahmad, M., Rajapaksha, A. U., Lim, J. E., Zhang, M., Bolan, N., Mohan, D., & Ok, Y. S. (2014). Biochar as a sorbent for contaminant management in soil and water: A review. Chemosphere, 99, 19–33.
https://doi.org/10.1016/j.chemosphere.2013.10.071 |
[18]
. Additional bands around 850–900 cm
−1 correspond to Fe–OH vibrations characteristic of goethite species
| [19] | Khelifi, S., Ayari, F., Hassan, C. D., Chehimi, D. B., Trabelsi-Ayadi, M., (2016). Synthesis and characterization of heterogeneous catalysts and comparison to iron-ore. J. Chem. Eng. Process Technol. 7, 316.
https://doi.org/10.4172/2157-7048.1000316 |
[19]
. These results confirm the successful incorporation of iron oxide species onto the activated carbon surface, which is essential for hydrogen peroxide activation during the heterogeneous Fenton process. Similar observations have been reported in previous studies
| [20] | Bopda, A., Mafo, S. G. M., Ndongmo, J. N., Kenda, G. T., Fotsop, C. G., Kuete, I.-H.-T., Ngakou, C. S., Tchuifon, D. R. T., Tamo, A. K., Nche, G.-N.-A., Anagho, S. G., (2022). Ferromagnetic biochar prepared from hydrothermally modified calcined mango seeds for Fenton-like degradation of indigo carmine. J. Carbon Res. 8, 81.
https://doi.org/10.3390/c8040081 |
| [21] | Ngankam, S., Lemankreo, D., Baissassou, D., Abdellaziz, B., Abdelrani, Y., Abdoul, N., (2020). Preparation and characterization of magnetic banana peels biochar for Fenton degradation of methylene blue. Mater. Sci. Appl. 11, 382–400.
https://doi.org/10.4236/msa.2020.116026 |
[20, 21]
.
3.3. X-ray Diffraction (XRD) Analysis
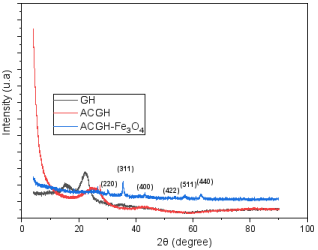
X-ray diffraction (XRD) analysis was carried out to determine the crystalline or amorphous structure of the synthesized materials. The obtained XRD patterns are presented in
Figure 3.
Figure 3. XRD diffractograms of GH, ACGH, and ACGH-Fe3O4.
The XRD patterns of GH and ACGH (
Figure 3) exhibit broad diffraction peaks around 2θ ≈ 22°–25°, characteristic of amorphous carbonaceous structures derived from cellulose, lignin, and hemicellulose components
| [22] | Poletto, M., Zattera, A. J., & Santana, R. M. C. (2012). Structural characteristics and thermal properties of native cellulose. Materials Science and Engineering: C, 32(6), 1121–1129. |
[22]
. The broad and low-intensity nature of these peaks indicates a disordered structure. After magnetization, the XRD pattern of ACGH-Fe
3O
4 displays well-defined diffraction peaks at 2θ ≈ 30.2°, 35.5°, 43.3°, 53.4°, 57.0°, and 62.6°, corresponding to the (220), (311), (400), (422), (511), and (440) planes of magnetite (Fe3O4), respectively. According to JCPDS card No. 19-0629, these reflections confirm the formation of the inverse cubic spinel structure of Fe
3O
4. Minor contributions from maghemite (γ-Fe
2O
3) may also be present
| [23] | Chaki, S. H., Tasmira, J. M., Chaudhary, M. D., Tailor, J. P., Deshpande, M. P., (2015). Magnetite nanoparticles synthesis by wet chemical reduction and their characterization. Adv. Nat. Sci.: Nanosci. Naonotechnol. 6, 32–40.
https://doi.org/10.1088/2043-6262/6/3/035009 |
| [24] | Gareth, D., James, M., (2021). Hydrothermal synthesis of biomass-derived magnetic carbon composites for adsorption and catalysis. ACS Omega 6, 48–67.
https://doi.org/10.1021/acsomega.1c05116 |
[23, 24]
. The appearance of these crystalline peaks confirms the successful incorporation of iron oxide nanoparticles into the carbon matrix during the co-precipitation process. These magnetic phases are responsible for both catalyst magnetic recoverability and the catalytic activation of H
2O
2 during the heterogeneous Fenton reaction.
3.4. SEM/EDX Analysis
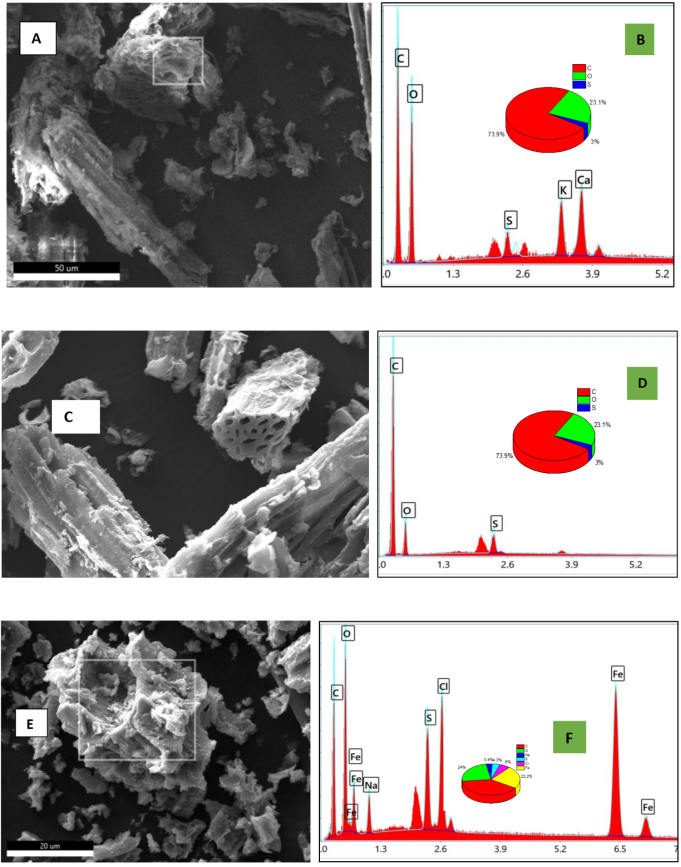
Scanning electron microscopy (SEM) coupled with energy-dispersive X-ray spectroscopy (EDX) was used to investigate the morphology and elemental composition of the synthesized materials. The SEM images and EDX spectra of GH, ACGH, and ACGH-Fe
3O
4 are presented in
Figure 4.
Figure 4. SEM micrographs and EDX spectra of GH (A and B), ACGH (C and D), and ACGH-Fe3O4 (E and F).
The SEM image of GH (
Figure 4A) shows a compact fibrous morphology with low porosity, characteristic of lignocellulosic biomass structures composed of cellulose, lignin, and hemicellulose
| [14] | Mbouombouo B. Jacques B., Guy, N. P., Jules, M. L., Harlette, Z. P., Maffeu, E. J., Said, M., et al. (2023). Removal of crystal violet by TiO2 loaded alkali-activated carbon hybrid material from Raphia farinifera fruit kernels: surface chemistry, parameters and mechanisms. Biomass Conv. Bioref.
https://doi.org/10.1007/s13399-023-04988-y |
| [22] | Poletto, M., Zattera, A. J., & Santana, R. M. C. (2012). Structural characteristics and thermal properties of native cellulose. Materials Science and Engineering: C, 32(6), 1121–1129. |
[14, 22]
. The corresponding EDX spectrum (
Figure 4B) indicates the predominance of oxygen and carbon, together with minor mineral elements such as K, Ca, and S originating from the natural composition of the biomass
| [2] | Benmessaoud, S.; Anissi, J.; Kara, M.; Assouguem, A.; AL-Huqail, A. A.; Germoush, M. O.; Ullah, R.; Ercisli, S.; Bahhou, J. (2022), Isolation and Characterization of Three New Crude Oil Degrading Yeast Strains, Candida Parapsilosis SK1, Rhodotorula Mucilaginosa SK2 and SK3. Sustainability, 14, 3465. |
[2]
. After phosphoric acid activation and carbonization, ACGH (
Figure 4C) exhibits a rough and highly porous surface with honeycomb-like structures and internal channels, indicating significant pore development due to chemical activation and volatile matter release during thermal treatment
| [14] | Mbouombouo B. Jacques B., Guy, N. P., Jules, M. L., Harlette, Z. P., Maffeu, E. J., Said, M., et al. (2023). Removal of crystal violet by TiO2 loaded alkali-activated carbon hybrid material from Raphia farinifera fruit kernels: surface chemistry, parameters and mechanisms. Biomass Conv. Bioref.
https://doi.org/10.1007/s13399-023-04988-y |
[14]
. Such porous structures are favorable for pollutant adsorption because they provide a larger surface area and more active sites
| [10] | A. R. D. Ahmad, S. S. Imam, W. Da Oh, R. Adnan, (2021). Fenton Degradation of Ofloxacin Using a Montmorillonite–Fe3 O4 Composite, Catalysts., 11 177. |
[10]
. The EDX spectrum of ACGH (
Figure 4D) shows an increase in carbon content and a decrease in mineral elements, confirming effective carbonization of the biomass
| [15] | Parshetti, G. K., Killedar, D. J., & Balasubramanian, R. (2010). Production of activated carbon from urban organic waste by chemical activation: application to adsorption of phenol. Chemical Engineering Journal, 165(1), 201–208.
https://doi.org/10.1016/j.cej.2010.09.019 |
[15]
. The SEM image of ACGH-Fe
3O
4 (
Figure 4E) reveals granular aggregates distributed on the carbon surface, corresponding to Fe
3O
4 nanoparticles partially covering the porous structure
| [25] | Cuerda-Correa, E. M., Alexandre-Franco, M. F., & Fernández-González, C. (2020). Adsorption of dyes on activated carbons: A review of the physical and chemical aspects. Environmental Chemistry Letters, 18(3), 687–707.
https://doi.org/10.1007/s10311-020-00979-2 |
| [26] | Ndongmo JN, Mabou JL, Tchuifon Tchuifon DR, Makota S, Fotsop CG, Conde M and Tchieta PG (2024), Synthesis and characterization of peanut shell-derived ferromagnetic activated carbon: application in the Fenton process for the degradation of methyl orange. Front. Environ. Chem. 5: 1375705. https://doi.org/10.3389/fenvc.2024.1375705 |
[25, 26]
. These particles contribute to the magnetic properties and catalytic activity of the composite during the heterogeneous Fenton reaction
| [5] | Zhang, Z., Shao, Y., Hu, Y., Shen, Y., & Chen, X. (2020). Magnetic biochar composites for wastewater treatment: A review. Environmental Pollution, 256, 113291.
https://doi.org/10.1016/j.envpol.2019.113291 |
[5]
. The porous structure developed during activation also facilitates the impregnation of iron oxide particles onto the carbon matrix
| [19] | Khelifi, S., Ayari, F., Hassan, C. D., Chehimi, D. B., Trabelsi-Ayadi, M., (2016). Synthesis and characterization of heterogeneous catalysts and comparison to iron-ore. J. Chem. Eng. Process Technol. 7, 316.
https://doi.org/10.4172/2157-7048.1000316 |
| [27] | Peng, Z., Fan, Z., Chen, X., Zhou, X., Gao, Z. F., Deng, S., Wan, S., Lv, X., Shi, Y., Han, W., (2022). Fabrication of nano iron oxide-modified biochar from co-hydrothermal carbonization of microalgae and Fe(II) salt for efficient removal of rhodamine B. Nanomaterials 12, 2271.
https://doi.org/10.3390/nanao12132271 |
[19, 27]
. This observation is confirmed by the EDX spectrum (
Figure 4F), which shows the presence of approximately 23% iron, demonstrating the successful incorporation of iron oxide species into the activated carbon structure.
3.5. Degradation of E124 Dye in Aqueous Medium via the Fenton Process
3.5.1. Catalytic Performance
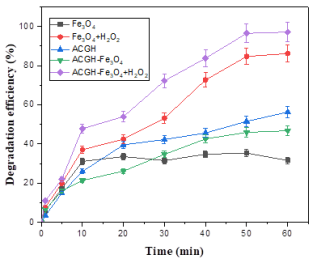
The catalytic performance of Fe
3O
4, ACGH, and ACGH-Fe
3O
4 materials was evaluated for the degradation of E124 dye in an aqueous medium, in the presence or absence of hydrogen peroxide (H
2O
2). The obtained results are presented in
Figure 5.
Figure 5. Degradation of E124 dye using Fe3O4, ACGH, and ACGH-Fe3O4 materials.
The removal of E124 dye was first evaluated in the presence of ACGH, the ACGH-Fe
3O
4 composite material, and pure magnetite (Fe
3O
4) particles, without the addition of H
2O
2 to the reaction medium. The results show that ACGH exhibits the highest adsorption capacity, with more than 52% of the dye removed after 60 minutes of contact, compared with the other two materials. This higher adsorption capacity can be attributed to its larger specific surface area (694.35 m
2.g
-1). The adsorption capacity of ACGH-Fe
3O
4 reaches 48%, which is slightly lower than that of ACGH. This decrease may be attributed to the partial blockage of the porous surface of ACGH by iron oxide particles during the co-precipitation process. In contrast, pure magnetite (Fe
3O
4) particles exhibit a lower adsorption capacity of 32% after 60 minutes of reaction, reflecting their limited surface area and adsorption ability. Furthermore, the degradation efficiency of E124 dye was investigated using different heterogeneous Fenton systems, namely Fe
3O
4 + H
2O
2 and ACGH-Fe
3O
4 + H
2O
2, in order to determine the most effective catalyst for the experimental design. The ACGH-Fe
3O
4 + H
2O
2 system exhibits the highest degradation efficiency, reaching nearly 99% after 60 minutes, which confirms the synergistic effect between activated carbon and Fe
3O
4 nanoparticles in the heterogeneous Fenton process. The superior efficiency of the ACGH-Fe
3O
4 + H
2O
2 system can be explained by the ability of Fe
2+ ions to activate H
2O
2 through the Fenton reaction Equation (
7), leading to the generation of highly reactive hydroxyl radicals (•OH) responsible for the oxidative degradation of the dye
| [26] | Ndongmo JN, Mabou JL, Tchuifon Tchuifon DR, Makota S, Fotsop CG, Conde M and Tchieta PG (2024), Synthesis and characterization of peanut shell-derived ferromagnetic activated carbon: application in the Fenton process for the degradation of methyl orange. Front. Environ. Chem. 5: 1375705. https://doi.org/10.3389/fenvc.2024.1375705 |
| [28] | Dilara Öztürk. (2022). Degradation of Reactive Orange 16 Dye With Heterogeneous Fenton Process Using Magnetic Nano-Sized Clay as Catalyst: A Central Composite Optimization Study. Hacettepe J. Biol. & Chem., 50(2), 113-129. |
[26, 28]
. The Fe
3O
4 + H
2O
2 system achieves approximately 91.83% degradation, highlighting the important role of iron species in the production of hydroxyl radicals via the Fenton reaction. These results confirm that the development of a heterogeneous catalyst based on ferromagnetic activated carbon represents a promising strategy for the treatment of colored wastewater
| [12] | Spessato, L.; Duarte, V. A.; Viero, P.; Zanella, H.; Fonseca, J. M.; Arroyo, P. A.; Almeida, V. C. (2021). Optimization of Sibipiruna Activated Carbon Preparation by Simplex-Centroid Mixture Design for Simultaneous Adsorption of Rhodamine B and Metformin. J. Hazard. Mater, 411, 125166. |
| [26] | Ndongmo JN, Mabou JL, Tchuifon Tchuifon DR, Makota S, Fotsop CG, Conde M and Tchieta PG (2024), Synthesis and characterization of peanut shell-derived ferromagnetic activated carbon: application in the Fenton process for the degradation of methyl orange. Front. Environ. Chem. 5: 1375705. https://doi.org/10.3389/fenvc.2024.1375705 |
[12, 26]
. Based on these findings, the subsequent degradation experiments were carried out using the ACGH-Fe
3O
4 composite catalyst in the heterogeneous Fenton system.
(7)
3.5.2. Effect of Parameters
Effect of pH
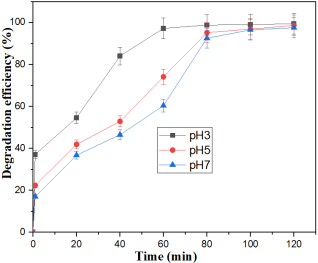
The pH of the reaction medium plays a crucial role in the heterogeneous Fenton process, as it strongly influences the generation of reactive species and the stability of iron ions. The effect of pH on the catalytic activity was investigated at three different pH values (3, 5, and 7) while keeping the other experimental parameters constant. The obtained results are presented in
Figure 6.
Figure 6. Effect of pH on the degradation of E124 dye.
As illustrated in
Figure 6, the degradation efficiency of E124 dye is significantly higher at pH 3. Indeed, a degradation efficiency exceeding 98% is achieved after 120 minutes, which is markedly higher than that obtained at pH 5 and pH 7. These results indicate that lower pH values favor the degradation process. This behaviour can be explained by the higher stability of Fe²⁺ ions under acidic conditions, which remain available to activate hydrogen peroxide and initiate the Fenton reaction. However, when the pH increases above 4, iron tends to form hydroxo complexes such as [FeOH] ⁺, as shown in Equation (
8)
| [29] | N. Um, T. Hirato, (2012). Precipitation of cerium sulfate converted from cerium oxide in sulfuric acid solutions and the conversion kinetics, Mater. Trans., 53, 1986–1991. |
| [30] | Duarte, F. M., Maldonado-Hódar, F. J., and Madeira, L. M. (2013). Influence of the iron precursor in the preparation of heterogeneous Fe/activated carbon Fenton-like catalysts. Appl. Catal. A General. 458, 39–47.
https://doi.org/10.1016/j.apcata.2013.03.030 |
[29, 30]
. At higher pH values (pH 5 and 7), although dye degradation still occurs, the reaction rate becomes slower, and the overall efficiency slightly decreases. This behaviour is consistent with the chemistry of the Fenton process, which relies on the generation of highly reactive hydroxyl radicals (•OH) according to Equations (
7) and (
9). Under acidic conditions (around pH 3), the solubility of iron species remains high, ensuring the availability of Fe
2+ ions required for the continuous generation of hydroxyl radicals. In addition, hydrogen peroxide remains relatively stable and decomposes efficiently to produce •OH radicals, which are responsible for the oxidative degradation of the dye molecules. Conversely, at neutral pH (pH 7), Fe
2+ ions tend to precipitate in the form of Fe(OH)₃, which significantly reduces the concentration of soluble iron available for catalysis. As a result, the production of •OH radicals decreases, leading to lower degradation efficiency. Furthermore, the oxidation potential of hydroxyl radicals decreases with increasing pH, which may also be associated with the dissociation and self-decomposition of H
2O
2 | [31] | J. Ma, W. Song, C. Chen, W. Ma, J. Zhao, Y. Tang, (2005). Fenton degradation of organic compounds promoted by dyes under visible irradiation, Environ. Sci. Technol. |
[31]
. These results confirm that the Fenton process is most effective under acidic conditions, as widely reported in the literature
| [32] | C. L. Tsokeing, S. D. M. Dongmo, E. J. Maffeu, P. G. Tchieta, J. D. Wansi,(2025). Study of the degradation of RY-145 by the Fenton process using a prepared magnetic Bentonite as heterogeneous catalyst, Hybrid Advances,
https://doi.org/10.1016/j.hybadv.2025.100463 |
[32]
. When the pH becomes too high, the precipitation of iron species reduces the reactivity of the catalytic system. Nevertheless, even at pH 5 and 7, the catalytic activity remains appreciable due to the presence of the ACGH-Fe
3O
4 composite catalyst, which may contribute to the stabilization of iron species and enhance pollutant adsorption on the catalyst surface. Based on these findings, pH was considered a key parameter in the experimental design and optimization using RSM.
Effect of Catalyst Mass
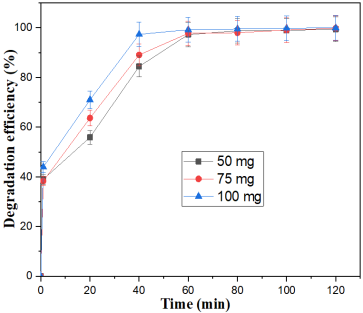
The effect of the ACGH-Fe
3O
4 catalyst mass on the degradation of E124 dye was investigated by varying the catalyst dosage at 50, 75, and 100 mg. The obtained results are presented in
Figure 7.
Figure 7. Effect of ACGH-Fe3O4 mass on the degradation of E124 dye.
As shown in
Figure 7, the degradation efficiency of E124 dye increases with increasing catalyst mass. At 100 mg, a degradation efficiency exceeding 95% is achieved within 60 minutes, compared to approximately 80% at 50 mg. This can be attributed to the increase in active catalytic sites and production of hydroxyl radicals (•OH)
| [33] | R. U. N. Foko, Cyrille G. Fotsop, D. R. Tchuifon, C. Banenzou´e, A. G. B. Azebaze, (2025). Green synthesis of magnetic type Zeolites 4A as catalyst for the elimination of quinoline yellow by the Fenton process: Optimization and kinetic investigation. Hybrid Advances,
https://doi.org/10.1016/j.hybadv.2025.100401 |
| [34] | M. Foroughi, S. J. Peighambardoust, B. Ramavandi, D. C. Boffito,(2024) Simultaneous anionic dyes degradation via H2O2 activation using Zeolite 4A/ZnO/Fe2 (MoO4)3 nanoparticles in a sono-photocatalytic process, Adv. Powder Technol. 35(1), 104320. |
[33, 34]
. However, beyond 75 mg, the increase in degradation efficiency becomes less pronounced, and the curve corresponding to 100 mg tends to reach a plateau. This behavior indicates that, above a certain catalyst dosage, the reaction becomes limited by the concentration of reactants, particularly H
2O
2 and dye molecules. Under these conditions, an equilibrium is established between the generation of hydroxyl radicals and their consumption by the pollutant, leading to a saturation effect. Similar trends have been widely reported in heterogeneous Fenton systems, where an optimal catalyst dosage is required to balance radical production and reactant availability
| [4] | Mirzaei, A., Chen, M., Haghighat, F., Yerushalmi, L. (2017). Removal of emerging contaminants from water and wastewater by photocatalysis: A review. Chemical Engineering Journal, 310, 41–62. https://doi.org/10.1016/j.cej.2016.05.081 |
| [10] | A. R. D. Ahmad, S. S. Imam, W. Da Oh, R. Adnan, (2021). Fenton Degradation of Ofloxacin Using a Montmorillonite–Fe3 O4 Composite, Catalysts., 11 177. |
[4, 10]
. From a mechanistic point of view, increasing the catalyst mass enhances the availability of Fe
2+/Fe
3+ redox sites, which are responsible for the catalytic decomposition of hydrogen peroxide according to the Fenton reaction (reaction 7). Thus, a higher catalyst dosage initially promotes the formation of •OH radicals, but beyond a certain threshold, the efficiency is no longer controlled by the number of active sites but rather by the availability of oxidant and substrate. These results clearly indicate the existence of an optimal catalyst mass, estimated to be between 75 and 100 mg, beyond which no significant improvement in degradation efficiency is observed. This behavior confirms the necessity of rational optimization of operating conditions in order to maximize degradation efficiency while minimizing catalyst consumption and operational costs
| [4] | Mirzaei, A., Chen, M., Haghighat, F., Yerushalmi, L. (2017). Removal of emerging contaminants from water and wastewater by photocatalysis: A review. Chemical Engineering Journal, 310, 41–62. https://doi.org/10.1016/j.cej.2016.05.081 |
| [10] | A. R. D. Ahmad, S. S. Imam, W. Da Oh, R. Adnan, (2021). Fenton Degradation of Ofloxacin Using a Montmorillonite–Fe3 O4 Composite, Catalysts., 11 177. |
[4, 10]
. Therefore, catalyst mass was identified as a key parameter and was incorporated into the RSM to determine the optimal operating conditions of the heterogeneous Fenton process.
Effect of Hydrogen Peroxide Concentration (H2O2)
Hydrogen peroxide (H
2O
2) is the key oxidizing agent in the Fenton process, as it is directly involved in the generation of highly reactive hydroxyl radicals (
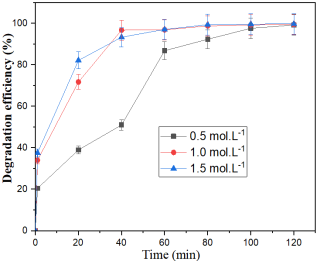
•OH) responsible for the degradation of organic pollutants such as E124 dye. The effect of H
2O
2 concentration was investigated by varying its concentration at 0.5, 1.0, and 1.5 mol.L
-1. The obtained results are presented in
Figure 8.
Figure 8. Effect of H₂O₂ concentration on the degradation of E124 dye.
As shown in
Figure 8, the degradation efficiency of E124 dye increases with increasing H
2O
2 concentration, reaching more than 95% at 1.5 mol.L
-1 after 60 minutes of reaction. This improvement can be attributed to the enhanced production of hydroxyl radicals (
•OH) through the Fenton reaction, which accelerates the oxidation of dye molecules. From a mechanistic point of view, the decomposition of hydrogen peroxide in the presence of Fe
2+ ions leads to the formation of
•OH radicals according to the classical Fenton reaction Equation (
7). Therefore, increasing the concentration of H
2O
2 promotes the generation of reactive species and enhances the degradation rate. However, beyond a certain threshold (around 1.0 mol.L
-1), the increase in degradation efficiency becomes less significant, indicating the occurrence of a saturation effect. This behavior is attributed to the involvement of parasitic reactions, in which excess H
2O
2 acts as a scavenger of hydroxyl radicals, thereby reducing their availability for pollutant degradation. One of the main side reactions is described by Equation (
9):
The formation of the perhydroxyl radical (OH
2•), which is significantly less reactive than
•OH •OH, leads to a decrease in the overall oxidation efficiency. In addition, the self-decomposition of H
2O
2 and its non-productive consumption further contribute to limiting the efficiency at high concentrations
| [36] | So, C. M., Cheng, M. Y., Yu, J. C., & Wong, P. K. Degradation of azo dye Procion Red MX- 5B by photocatalytic oxidation. Chemosphere, 2002, 46, 905-912. |
| [37] | So, C. M., Cheng, M. Y., Yu, J. C., & Wong, P. K(2002). Degradation of azo dye Procion Red MX- 5B by photocatalytic oxidation. Chemosphere, 46, 905-912. |
[36, 37]
. These results highlight that the degradation process is governed by a balance between the generation and scavenging of hydroxyl radicals. Consequently, an optimal H
2O
2 concentration is required to maximize degradation efficiency while minimizing reagent consumption. Similar trends have been widely reported in heterogeneous Fenton systems, confirming that excessive oxidant dosage does not necessarily improve performance due to radical scavenging effects
| [35] | Panda, N., Sahoo, H., Mohapatra, S., (2011). Decolourization of methyl orange using Fenton like mesoporous Fe2O3-SiO2 composite. J. Hazard. Mater. 185(1), 359–365.
https://doi.org/10.1016/j.jhazmat.2010.09.042 |
| [36] | So, C. M., Cheng, M. Y., Yu, J. C., & Wong, P. K. Degradation of azo dye Procion Red MX- 5B by photocatalytic oxidation. Chemosphere, 2002, 46, 905-912. |
| [37] | So, C. M., Cheng, M. Y., Yu, J. C., & Wong, P. K(2002). Degradation of azo dye Procion Red MX- 5B by photocatalytic oxidation. Chemosphere, 46, 905-912. |
[35-37]
. Therefore, H
2O
2 concentration was identified as a critical parameter and was included in the response surface methodology (RSM) to determine the optimal operating conditions.
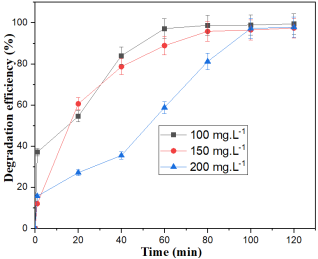
Effect of Initial Dye Concentration
The effect of the initial concentration of E124 dye on the degradation efficiency was investigated at three concentrations (100, 150, and 200 mg.L
-1). The obtained results are presented in
Figure 9.
Figure 9. Effect of initial E124 concentration on the degradation efficiency.
As shown in
Figure 9, the degradation efficiency decreases with increasing initial dye concentration. At 100 mg.L
-1, a degradation efficiency exceeding 95% is achieved, whereas at 200 mg.L
-1, the degradation process becomes slower within the same reaction time. This behavior can be explained by several factors. First, at higher dye concentrations, a larger number of pollutant molecules are present in the solution, leading to increased competition for the available hydroxyl radicals (
•OH). Since the amount of radicals generated remains relatively constant under fixed operating conditions, their availability becomes insufficient to effectively degrade all dye molecules. Second, higher pollutant concentrations may lead to partial saturation of the catalyst active sites, as more dye molecules are adsorbed onto the surface of the catalyst. This can limit the accessibility of reactive sites and reduce the efficiency of catalytic reactions occurring at the solid–liquid interface
| [38] | Saquib, M., & Muneer, M. (2003). TiO2-mediated photocatalytic degradation of a triphenylmethane dye (gentian violet), in aqueous suspensions. Dyes Pigm., 56, 37-49. |
[38]
. In addition, increasing dye concentration can affect the mass transfer and diffusion processes, as well as the interaction between the oxidant, catalyst, and pollutant molecules, further contributing to the reduction in degradation efficiency. Overall, the degradation rate is found to be inversely proportional to the initial dye concentration over the investigated time interval. This trend is consistent with numerous studies reported in the literature, where higher initial pollutant concentrations result in lower degradation efficiencies due to limited availability of reactive species
| [4] | Mirzaei, A., Chen, M., Haghighat, F., Yerushalmi, L. (2017). Removal of emerging contaminants from water and wastewater by photocatalysis: A review. Chemical Engineering Journal, 310, 41–62. https://doi.org/10.1016/j.cej.2016.05.081 |
| [12] | Spessato, L.; Duarte, V. A.; Viero, P.; Zanella, H.; Fonseca, J. M.; Arroyo, P. A.; Almeida, V. C. (2021). Optimization of Sibipiruna Activated Carbon Preparation by Simplex-Centroid Mixture Design for Simultaneous Adsorption of Rhodamine B and Metformin. J. Hazard. Mater, 411, 125166. |
[4, 12]
. These results confirm that the performance of the heterogeneous Fenton process strongly depends on the ratio between oxidant, catalyst, and pollutant concentration. Therefore, the initial dye concentration was identified as a key parameter and was included in the RSM) to determine the optimal operating conditions.
3.5.3. Optimization of E124 Degradation and Statistical Modeling
The optimization of E124 dye degradation using the heterogeneous Fenton process was carried out using RSM based on the BBD. A total of 30 experimental runs were generated to evaluate the combined effects of four independent variables, namely pH (A), catalyst mass (B), initial dye concentration (C), and H
2O
2 concentration (D). The experimental design matrix, along with the corresponding observed and predicted degradation efficiencies, is presented in
Table 3.
Table 3. Experimental design matrix and corresponding observed and predicted degradation efficiencies for E124 removal.
Experiment | A: pH | B: catalyst mass (mg) | C: Dye concentration (mg.L-1) | D: H2O2 concentration (mol L-1) | Degradation efficiency (%) |
Observed value | Predicted value |
1 | 3 | 50 | 150 | 1 | 94.1673 | 92.5291 |
2 | 7 | 50 | 150 | 1 | 80.5530 | 79.0643 |
3 | 3 | 100 | 150 | 1 | 97.4550 | 87.1989 |
4 | 7 | 100 | 150 | 1 | 97.4987 | 87.3921 |
5 | 5 | 75 | 100 | 0.5 | 99.9458 | 84.3896 |
6 | 5 | 75 | 200 | 0.5 | 29.1394 | 19.6635 |
7 | 5 | 75 | 100 | 1.5 | 98.8405 | 96.5716 |
8 | 5 | 75 | 200 | 1.5 | 98.6167 | 102.428 |
9 | 3 | 75 | 150 | 0.5 | 42.0506 | 55.4147 |
10 | 7 | 75 | 150 | 0.5 | 33.8104 | 45.3074 |
11 | 3 | 75 | 150 | 1.5 | 99.8904 | 99.4165 |
12 | 7 | 75 | 150 | 1.5 | 98.5933 | 96.2522 |
13 | 5 | 50 | 100 | 1 | 97.7167 | 97.7485 |
14 | 5 | 100 | 100 | 1 | 98.5851 | 108.109 |
15 | 5 | 50 | 200 | 1 | 75.6771 | 77.1759 |
16 | 5 | 100 | 200 | 1 | 58.8213 | 69.8126 |
17 | 3 | 75 | 100 | 1 | 97.1476 | 100.423 |
18 | 7 | 75 | 100 | 1 | 96.7609 | 101.754 |
19 | 3 | 75 | 200 | 1 | 83.2267 | 78.9551 |
20 | 7 | 75 | 200 | 1 | 66.9067 | 64.3527 |
21 | 5 | 50 | 150 | 0 5 | 49.9452 | 50.4680 |
22 | 5 | 100 | 150 | 0.5 | 54.2865 | 53.9346 |
23 | 5 | 50 | 150 | 1.5 | 98.8356 | 99.9091 |
24 | 5 | 100 | 150 | 1.5 | 99.2413 | 99.4402 |
25 | 5 | 75 | 150 | 1 | 61.7519 | 61.7519 |
26 | 5 | 75 | 150 | 1 | 61.7519 | 61.7519 |
27 | 5 | 75 | 150 | 1 | 61.7519 | 61.7519 |
28 | 5 | 75 | 150 | 1 | 61.7519 | 61.7519 |
29 | 5 | 75 | 150 | 1 | 61.7519 | 61.7519 |
30 | 5 | 75 | 150 | 1 | 61.7519 | 61.7519 |
The comparison between experimental and predicted values shows good overall agreement, indicating that the developed quadratic model adequately describes the behavior of the heterogeneous Fenton system. Higher reproducibility was observed near the central points, whereas some deviations appeared under specific operating conditions, particularly in experiments 5, 6, and 14. These discrepancies may be attributed to the complexity of the heterogeneous Fenton process, which involves simultaneous adsorption, catalytic oxidation, hydroxyl radical generation, and mass transfer phenomena. The observed non-linear behavior confirms the importance of including quadratic and interaction terms in the model. Indeed, degradation efficiency depends on the combined effects of pH, catalyst dosage, pollutant concentration, and H2O2 concentration, as well as on the balance between Fe2+/Fe3+ active sites, hydroxyl radical generation, and oxidant consumption. These results demonstrate that the BBD is an effective approach for modeling and optimizing E124 degradation under heterogeneous Fenton conditions.
(i). Analysis of Variance (ANOVA)
Analysis of variance (ANOVA) was performed to statistically evaluate the significance of the model and to identify the most influential factors affecting the degradation efficiency of E124 dye in the heterogeneous Fenton process optimized by RSM
| [39] | Aurelien, B., Sandrale, G., Josiane, N. N., Georges, T. K., Cyrille, G. F., Tiotsop Kuete, I.-H., et al. (2022). Ferromagnetic biochar prepared from hydrothermally modified calcined mango seeds for fenton-like degradation of indigo carmine, 8, 81. https://doi.org/10.3390/c8040081 |
[39]
. The ANOVA results are summarized in
Table 4.
Table 4. Analysis of variance for the degradation of Cochineal Red A in the presence of ACGH–Fe3O4.
Source | Sum of squares | Df | Mean square | F-Ratio | p-Value | Remark |
Model | 13604.9 | 14 | 13604.9 | 12.61 | 0.0000 | |
A-pH | 164.916 | 1 | 164.916 | 1.94 | 0.1835 | |
B-catalyst dose | 6.73944 | 1 | 6.73944 | 0.08 | 0.7819 | |
C-Poluttant concentration | 2599.22 | 1 | 2599.22 | 30.64 | 0.0001 | Significant |
D-H2O2 concentration | 6984.71 | 1 | 6984.71 | 82.34 | 0.0000 | Significant |
AB | 46.6351 | 1 | 46.6351 | 46.6351 | 0.4699 | |
AC | 63.4671 | 1 | 63.4671 | 63.4671 | 0.4007 | |
AD | 33.7215 | 1 | 33.7215 | 33.7215 | 0.5379 | |
BC | 78.5373 | 1 | 78.5373 | 0.93 | 0.3512 | |
BD | 3.87218 | 1 | 3.87218 | 0.05 | 0.8337 | |
CD | 1245.48 | 1 | 1245.48 | 14.68 | 0.0016 | Significant |
A2 | 842.997 | 1 | 842.997 | 14.76 | 0.0066 | Significant |
B2 | 1251.91 | 1 | 1251.91 | 14.76 | 0.0016 | Significant |
C2 | 1219.73 | 1 | 1219.73 | 14.38 | 0.0018 | Significant |
D2 | 1.57707 | 1 | 1.57707 | 0.02 | 0.8934 | |
Residual | 1272.47 | 15 | 84.8312 | | | |
Lack of fit | 1272.47 | 10 | | | | |
Pure error | 0.00001 | 5 | | | | |
Cor total | 15188.0 | 29 | | | | |
The results indicate that the quadratic regression model is highly significant, with an F-value of 12.61 and a p-value < 0.0001, confirming that the model provides a statistically reliable description of the relationship between the operating variables and the degradation efficiency. The goodness of fit of the model is supported by a coefficient of determination (R
2) of 92.17% and an adjusted R
2 of 84.86%, indicating that a large proportion of the variability in the response is explained by the model. The relatively good agreement between these values suggests the absence of significant overfitting. Furthermore, the Durbin–Watson statistic (~2.42) indicates no significant autocorrelation in the residuals, confirming the adequacy of the regression model. Among the main effects, H
2O
2 concentration (D) and initial dye concentration (C) are identified as the most significant parameters (p < 0.001), highlighting their dominant role in controlling the degradation process. This result is consistent with the chemistry of the Fenton reaction, where the generation of hydroxyl radicals (reaction7) and the pollutant load are key factors governing the reaction efficiency
| [40] | Moreira, F. C.; Soler, J.; Fonseca, A.; Saraiva, I.; Boaventura, R. A. R.; Brillas, E.; Vilar, V. J. P. (2016). Electrochemical Advanced Oxidation Processes for Sanitary Landfill Leachate Remediation: Evaluation of Operational Variables. Appl. Catal. B Environ., 182, 161–171. |
| [41] | Sun, J. H.; Sun, S. P.; Wang, G. L.; Qiao, L. P. (2007) Degradation of Azo Dye Amido Black 10B in Aqueous Solution by Fenton Oxidation Process. Dyes Pigment., 74, 647–652. |
[40, 41]
. The interaction term CD (pollutant concentration × H
2O
2 concentration) is also statistically significant (p < 0.01), indicating that the effect of H
2O
2 strongly depends on the initial dye concentration. This interaction reflects the balance between radical generation and radical consumption, particularly under conditions where excess oxidant may induce scavenging reactions, thereby reducing the availability of •OH radicals for pollutant degradation
| [40] | Moreira, F. C.; Soler, J.; Fonseca, A.; Saraiva, I.; Boaventura, R. A. R.; Brillas, E.; Vilar, V. J. P. (2016). Electrochemical Advanced Oxidation Processes for Sanitary Landfill Leachate Remediation: Evaluation of Operational Variables. Appl. Catal. B Environ., 182, 161–171. |
| [42] | Lamsal, R. et al. Application of Box–Behnken method for advanced oxidation process optimization: insights into parameter interactions and process efficiency. Journal of Environmental Health Science & Engineering 12, 67 (2017). |
[40, 42]
. In addition, the quadratic terms A
2 (pH), B
2 (catalyst mass), and C
2 (pollutant concentration) are significant (p < 0.01), confirming the presence of non-linear effects and the existence of optimal operating conditions. This behavior is typical of heterogeneous Fenton systems, where the efficiency is governed by complex interactions between chemical kinetics, adsorption phenomena, and mass transfer processes
| [42] | Lamsal, R. et al. Application of Box–Behnken method for advanced oxidation process optimization: insights into parameter interactions and process efficiency. Journal of Environmental Health Science & Engineering 12, 67 (2017). |
| [43] | Adachi, A. et al. (2023). Optimization of heterogeneous Fenton-like processes using response surface methodology: a case study on dye degradation. SN Applied Sciences 5, 342(2023). |
[42, 43]
. Overall, these results demonstrate that the degradation process cannot be adequately described by a simple linear model and justify the use of a second-order polynomial model within the RSM framework. Based on multiple regression analysis of the experimental data obtained from the Box–Behnken design, the degradation efficiency (%) of E124 dye can be described by the following second-order polynomial equation:
(10)
where A, B, C, and D correspond to pH, catalyst mass, initial dye concentration, and H
2O
2 concentration, respectively. The regression coefficients confirmed that H
2O
2 concentration and pollutant concentration were the most influential variables. Significant interaction and quadratic terms further demonstrated the complex and non-linear nature of the heterogeneous Fenton process, governed by radical generation, scavenging reactions, and transport phenomena
| [44] | Minireview (2024): Integration of design of experiments, ANOVA and response surface methodology in heterogeneous catalysis processes. Environmental and Experimental Toxicology. |
[44]
.
(ii). Response Surface Analysis
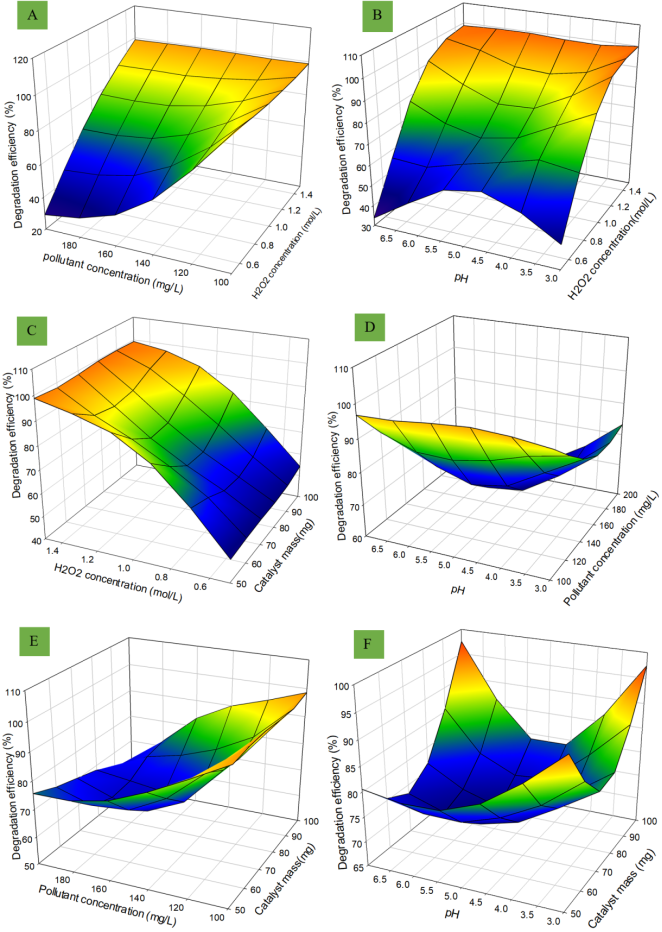
The three-dimensional (3D) response surface plots illustrating the combined effects of the operating variables on the degradation efficiency of E124 dye are presented in
Figure 10.
Figure 10. A–F represent the interaction effects between the operating parameters on E124 degradation efficiency.
Figure 10A shows that degradation efficiency increases with H
2O
2 concentration but decreases with increasing dye concentration. At low pollutant concentrations, the generated hydroxyl radicals (•OH) are sufficient for effective oxidation, whereas at higher concentrations, radical availability becomes limited due to competition between dye molecules
| [42] | Lamsal, R. et al. Application of Box–Behnken method for advanced oxidation process optimization: insights into parameter interactions and process efficiency. Journal of Environmental Health Science & Engineering 12, 67 (2017). |
| [45] | Kouotou, D., Ghalit, M., Ndi, J. N., Martinez, L. M. P., Ouahabi, M. E., Ketcha, J. M., et al. (2021). Removal of metallic trace elements (Pb2+, Cd2+, Cu2+, and Ni2 +) from aqueous solution by adsorption onto cerium oxide modified activated carbon. Environ. Monitoring Assess. 193(8), 467.
https://doi.org/10.1007/s10661-021-09267-9 |
[42, 45]
.
Figure 10B indicates that the highest degradation efficiencies are obtained under moderately acidic conditions (pH 3–5) and high H
2O
2concentrations. Acidic conditions favor Fe
2+ stability and efficient H
2O
2 decomposition into •OH radicals, while higher pH values reduce efficiency because of iron precipitation and non-productive H
2O
2 decomposition
| [4] | Mirzaei, A., Chen, M., Haghighat, F., Yerushalmi, L. (2017). Removal of emerging contaminants from water and wastewater by photocatalysis: A review. Chemical Engineering Journal, 310, 41–62. https://doi.org/10.1016/j.cej.2016.05.081 |
| [45] | Kouotou, D., Ghalit, M., Ndi, J. N., Martinez, L. M. P., Ouahabi, M. E., Ketcha, J. M., et al. (2021). Removal of metallic trace elements (Pb2+, Cd2+, Cu2+, and Ni2 +) from aqueous solution by adsorption onto cerium oxide modified activated carbon. Environ. Monitoring Assess. 193(8), 467.
https://doi.org/10.1007/s10661-021-09267-9 |
[4, 45]
. As shown in
Figure 10C, increasing catalyst dosage and H
2O
2 concentration enhances degradation efficiency due to the greater availability of active sites and oxidant. However, the presence of a plateau region suggests the existence of optimal operating conditions beyond which further increases become ineffective because of radical recombination or inefficient oxidant utilization
| [6] | Ganzenko, O.; Trellu, C.; Oturan, N.; Huguenot, D.; Péchaud, Y.; van Hullebusch, E. D.; Oturan, M. A. (2020) Electro-Fenton Treatment of a Complex Pharmaceutical Mixture: Mineralization Efficiency and Biodegradability Enhancement. Chemosphere, 253, 126659. |
| [12] | Spessato, L.; Duarte, V. A.; Viero, P.; Zanella, H.; Fonseca, J. M.; Arroyo, P. A.; Almeida, V. C. (2021). Optimization of Sibipiruna Activated Carbon Preparation by Simplex-Centroid Mixture Design for Simultaneous Adsorption of Rhodamine B and Metformin. J. Hazard. Mater, 411, 125166. |
[6, 12]
.
Figure 10D demonstrates that pH effects are more pronounced at low pollutant concentrations, whereas at high dye concentrations the process becomes mainly limited by pollutant load
| [39] | Aurelien, B., Sandrale, G., Josiane, N. N., Georges, T. K., Cyrille, G. F., Tiotsop Kuete, I.-H., et al. (2022). Ferromagnetic biochar prepared from hydrothermally modified calcined mango seeds for fenton-like degradation of indigo carmine, 8, 81. https://doi.org/10.3390/c8040081 |
| [41] | Sun, J. H.; Sun, S. P.; Wang, G. L.; Qiao, L. P. (2007) Degradation of Azo Dye Amido Black 10B in Aqueous Solution by Fenton Oxidation Process. Dyes Pigment., 74, 647–652. |
[39, 41]
.
Figure 10E shows that increasing catalyst mass partially compensates for the negative effect of high dye concentration, although active site saturation occurs at elevated pollutant levels
| [5] | Zhang, Z., Shao, Y., Hu, Y., Shen, Y., & Chen, X. (2020). Magnetic biochar composites for wastewater treatment: A review. Environmental Pollution, 256, 113291.
https://doi.org/10.1016/j.envpol.2019.113291 |
| [7] | Kamagate, M.; Assadi, A. A.; Kone, T.; Giraudet, S.; Coulibaly, L.; Hanna, K. (2018) Use of Laterite as a Sustainable Catalyst for Removal of Fluoroquinolone Antibiotics from Contaminated Water. Chemosphere, 195, 847–853. |
[5, 7]
.
Figure 10F reveals a moderate interaction between catalyst dosage and pH, with optimal degradation observed under moderately acidic conditions and intermediate catalyst loading
| [4] | Mirzaei, A., Chen, M., Haghighat, F., Yerushalmi, L. (2017). Removal of emerging contaminants from water and wastewater by photocatalysis: A review. Chemical Engineering Journal, 310, 41–62. https://doi.org/10.1016/j.cej.2016.05.081 |
| [9] | R. Zhu, Y. Zhu, H. Xian, L. Yan, H. Fu, G. Zhu, Y. Xi, J. Zhu, H. He, C. N. T.s/. (2020). ferrihydrite as a highly efficient heterogeneous Fenton catalyst for the degradation of bisphenol A: The important role of C. N. T.s in accelerating Fe(III)/Fe(II) cycling, Appl. Catal. B Environ., 270. |
[4, 9]
. Overall, the response surface analysis confirms that E124 degradation is governed by strong interactions and non-linear effects between pH, catalyst dosage, pollutant concentration, and H
2O
2 concentration. These findings validate the applicability of the quadratic RSM model and confirm that degradation efficiency depends on the balance between hydroxyl radical generation, oxidant consumption, and catalyst activity.
(iii). Model Validation and Experimental Confirmation
The optimal operating conditions predicted by the model were pH = 5, catalyst dosage = 75 mg, initial dye concentration = 100 mg.L-1, and H2O2 concentration = 1.5 mol.L-1, with a predicted degradation efficiency of 99.97% (desirability = 1). Confirmatory experiments performed under these conditions yielded results in excellent agreement with the model predictions, confirming its accuracy and robustness. These findings demonstrate the reliability of the RSM–Box–Behnken approach and highlight the high efficiency of the ACGH-Fe3O4 catalyst for E124 degradation via the heterogeneous Fenton process.
3.6. Kinetic Study
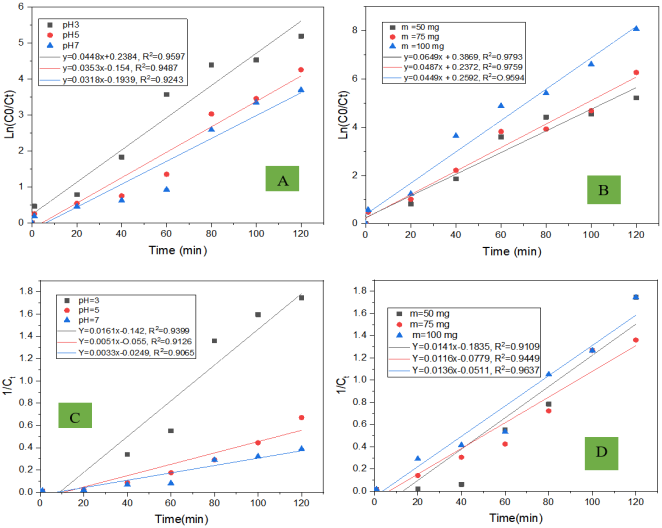
Figure 11(A–D) present the kinetic modeling of E124 degradation using pseudo-first-order and pseudo-second-order models.
Figure 11. Kinetics of first order (A and B) second order (C and D) degradation of E124.
The pseudo-first-order model (
Figure 11A and 11B) exhibits a strong linear relationship, with high correlation coefficients (R² ≈ 0.924–0.959), indicating a good fit with the experimental data. The apparent rate constant increases under acidic conditions and with increasing catalyst dosage, reflecting enhanced generation of hydroxyl radicals (•OH) and improved catalytic activity. In contrast, the pseudo-second-order model (
Figure 11C and 11D) shows lower correlation coefficients (R² ≈ 0.90–0.94), suggesting a less satisfactory description of the degradation kinetics. This weaker fit indicates that the process is not primarily governed by chemisorption or surface site limitations. These results demonstrate that the degradation of E124 is better described by a pseudo-first-order kinetic model, which is consistent with a mechanism dominated by radical oxidation reactions. Such behavior is commonly reported in efficient heterogeneous Fenton systems, where high •OH availability minimizes mass transfer and adsorption limitations
| [2] | Benmessaoud, S.; Anissi, J.; Kara, M.; Assouguem, A.; AL-Huqail, A. A.; Germoush, M. O.; Ullah, R.; Ercisli, S.; Bahhou, J. (2022), Isolation and Characterization of Three New Crude Oil Degrading Yeast Strains, Candida Parapsilosis SK1, Rhodotorula Mucilaginosa SK2 and SK3. Sustainability, 14, 3465. |
| [9] | R. Zhu, Y. Zhu, H. Xian, L. Yan, H. Fu, G. Zhu, Y. Xi, J. Zhu, H. He, C. N. T.s/. (2020). ferrihydrite as a highly efficient heterogeneous Fenton catalyst for the degradation of bisphenol A: The important role of C. N. T.s in accelerating Fe(III)/Fe(II) cycling, Appl. Catal. B Environ., 270. |
| [46] | Raji, K. et al. (2022). Prediction of heterogeneous Fenton process in treatment of melanoidin-containing wastewater using data-based models. Journal of Environmental Management 307, 114613. |
[2, 9, 46]
. Overall, the kinetic analysis confirms that the degradation process is mainly controlled by hydroxyl radical-driven oxidation, in agreement with the mechanistic framework of heterogeneous Fenton reactions.
3.7. Catalyst Reusability and Magnetic Stability at Optimal Conditions
The reusability of the ferromagnetic catalyst was evaluated to assess its stability and practical applicability in the heterogeneous Fenton process. Recycling experiments were conducted under the optimal conditions determined by response surface methodology (pH = 5, catalyst dosage = 75 mg, initial E124 concentration = 100 mg.L
-1, and H
2O
2 concentration = 1.5 mol.L
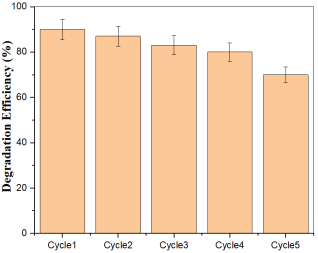
-1). After each reaction cycle, the catalyst was magnetically separated from the aqueous solution, thoroughly washed with distilled water and ethanol to remove adsorbed intermediates, and then dried at 100°C for 1 h before to reuse. This procedure was repeated over five consecutive degradation cycles, and the results are presented in
Figure 12.
Figure 12. Changes in the degradation efficiency of E124 dye over five successive cycles.
As shown in
Figure 12, a gradual decrease in degradation efficiency is observed with increasing number of cycles, while maintaining relatively high performance (≈70%) after the fifth cycle. This moderate decline can be attributed to several factors, including partial passivation of active iron sites, accumulation of reaction intermediates on the catalyst surface, and possible limited leaching of Fe
2+/Fe
3+ species during repeated use. Despite this decrease, the catalyst retains significant catalytic activity, demonstrating good structural integrity and stability. Importantly, the magnetic properties of ACGH-Fe
3O
4 enable rapid and efficient recovery from the reaction medium, minimizing material loss and facilitating reuse. These results highlight the good reusability and operational stability of the synthesized catalyst, confirming its suitability for repeated applications in wastewater treatment. The observed performance is consistent with previously reported magnetic carbon-based heterogeneous Fenton catalysts, where slight deactivation over cycles is commonly associated with surface fouling and iron leaching phenomena
| [14] | Mbouombouo B. Jacques B., Guy, N. P., Jules, M. L., Harlette, Z. P., Maffeu, E. J., Said, M., et al. (2023). Removal of crystal violet by TiO2 loaded alkali-activated carbon hybrid material from Raphia farinifera fruit kernels: surface chemistry, parameters and mechanisms. Biomass Conv. Bioref.
https://doi.org/10.1007/s13399-023-04988-y |
| [17] | Djouonkep, L. D. W., Tamo, A. K., Doench, I., Selabi, N. B. S., Ilunga, E. M., Lenwoue, A. k., et al. (2022). Synthesis of high performance thiophene–aromatic polyesters from bio-sourced organic acids and polysaccharide-derived diol: characterization and degradability studies. Mol 27, 325.
https://doi.org/10.3390/molecules27010325 |
[14, 17]
.
3.8. Comparison with Other Heterogeneous Fenton Catalysts
Table 5 summarizes the performance of various heterogeneous Fenton catalysts reported in the literature for the degradation of azo dyes, and compares them with the ACGH–Fe
3O
4 catalyst developed in this study. Under the optimized operating conditions (pH = 5, catalyst dose = 75 mg, H
2O
2 concentration = 1.5 mol.L
-1, and initial dye concentration = 100 mg.L
-1), a degradation efficiency of 99.97% was achieved.
Table 5. Comparison of different heterogeneous Fenton catalysts for azo dye degradation.
Catalyst | Precursor/Support | Pollutant | Optimal conditions (pH /H2O2) | Degradation efficiency (%) | Reusability | Reference |
ACGH-Fe3O4 | Cotton stalks / H3PO4 | E124 (Cochineal Red A) | pH 5 / 1,5 mol.L-1 | > 98% | Stable (5 cycles) | This work |
Fe3O4/activated carbon | Lignocellulosic biomass | Orange II | 3 / 1.0 mol.L-1 | 95% | 4 cycles | | [4] | Mirzaei, A., Chen, M., Haghighat, F., Yerushalmi, L. (2017). Removal of emerging contaminants from water and wastewater by photocatalysis: A review. Chemical Engineering Journal, 310, 41–62. https://doi.org/10.1016/j.cej.2016.05.081 |
[4] |
Magnetic Fe–biochar | Rice husk | Methylene blue | pH 4 / 0.8 mol.L-1 | 93% | 5 cycles | | [10] | A. R. D. Ahmad, S. S. Imam, W. Da Oh, R. Adnan, (2021). Fenton Degradation of Ofloxacin Using a Montmorillonite–Fe3 O4 Composite, Catalysts., 11 177. |
[10] |
Fe3O4/graphene | Synthetic graphene | Rhodamine B | pH 3 / 1.0 mol·L⁻¹ | 97% | 6 cycles | | [9] | R. Zhu, Y. Zhu, H. Xian, L. Yan, H. Fu, G. Zhu, Y. Xi, J. Zhu, H. He, C. N. T.s/. (2020). ferrihydrite as a highly efficient heterogeneous Fenton catalyst for the degradation of bisphenol A: The important role of C. N. T.s in accelerating Fe(III)/Fe(II) cycling, Appl. Catal. B Environ., 270. |
[9] |
Magnetic Fe–AC | Commercial activated carbon | Reactive Red 120 | pH 5 / 1.2 mol.L-1 | 96% | 5 cycles | | [12] | Spessato, L.; Duarte, V. A.; Viero, P.; Zanella, H.; Fonseca, J. M.; Arroyo, P. A.; Almeida, V. C. (2021). Optimization of Sibipiruna Activated Carbon Preparation by Simplex-Centroid Mixture Design for Simultaneous Adsorption of Rhodamine B and Metformin. J. Hazard. Mater, 411, 125166. |
[12] |
Fe2O3/biochar | Agricultural waste | Congo Red | pH 4 / 1.0 mol.L-1 | 90% | 3 cycles | | [46] | Raji, K. et al. (2022). Prediction of heterogeneous Fenton process in treatment of melanoidin-containing wastewater using data-based models. Journal of Environmental Management 307, 114613. |
[46] |
Fe–carbon composite | Wood residues | Acid Orange 7 | pH 3 / 1.5 mol.L-1 | 94% | 4 cycles | | [6] | Ganzenko, O.; Trellu, C.; Oturan, N.; Huguenot, D.; Péchaud, Y.; van Hullebusch, E. D.; Oturan, M. A. (2020) Electro-Fenton Treatment of a Complex Pharmaceutical Mixture: Mineralization Efficiency and Biodegradability Enhancement. Chemosphere, 253, 126659. |
[6] |
The comparison clearly indicates that the ACGH-Fe3O4 catalyst exhibits competitive if not superior performance relative to previously reported heterogeneous Fenton systems. The high degradation efficiency (>98%) obtained in this study is comparable to or exceeds that of advanced materials such as Fe3O4/graphene, while maintaining excellent reusability over five cycles. This enhanced performance can be attributed to several synergistic effects.





 Share This Article
 Twitter
 Linked In
 Facebook
 Copy
Copy Download